LiveResearchBench
A Live Benchmark for User-Centric Deep Research in the Wild
Overview
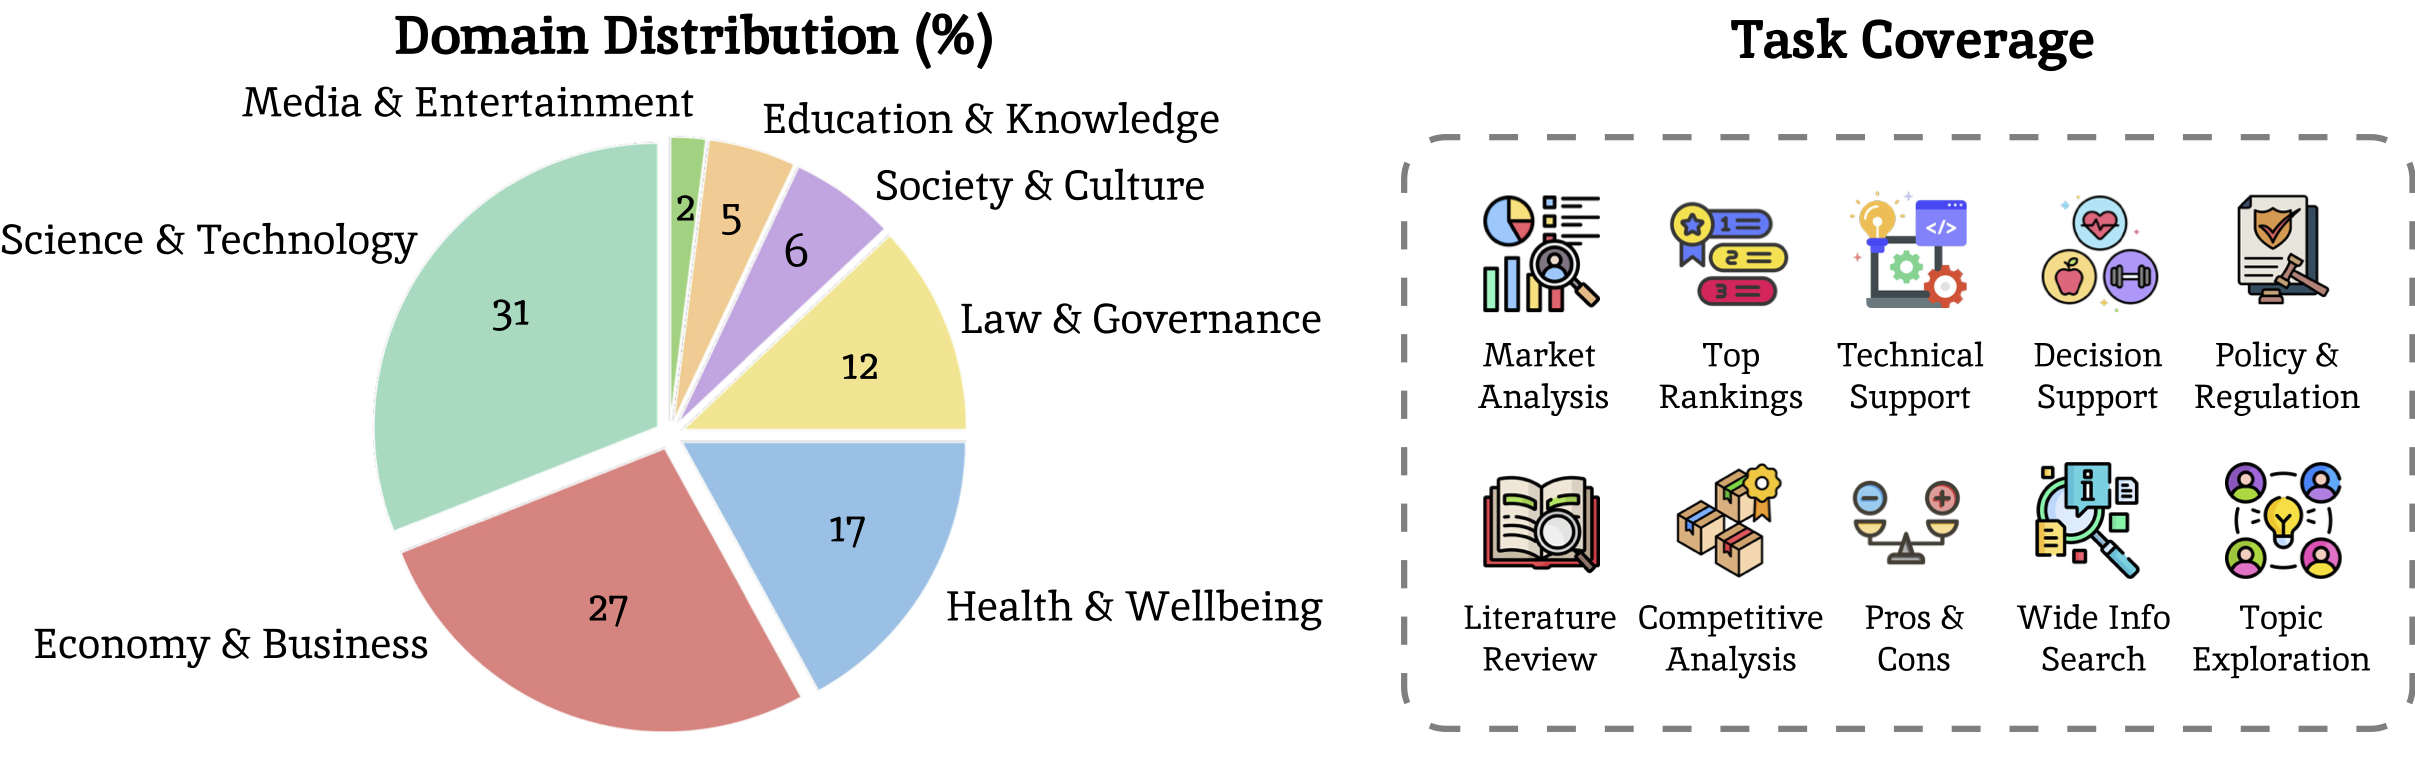
Deep research—producing comprehensive, citation-grounded reports by searching and synthesizing information from hundreds of live web sources—marks an important frontier for agentic systems. To rigorously evaluate this ability, four principles are essential: tasks should be (1) user-centric, reflecting realistic information needs, (2) dynamic, requiring up-to-date information beyond parametric knowledge, (3) unambiguous, ensuring consistent interpretation across users, and (4) multi-faceted and search-intensive, requiring search over numerous web sources and in-depth analysis. Existing benchmarks fall short of these principles, often focusing on narrow domains or posing ambiguous questions that hinder fair comparison. Guided by these principles, we introduce LiveResearchBench, a benchmark of 100 expert-curated tasks spanning daily life, enterprise, and academia, each requiring extensive, dynamic, real-time web search and synthesis. Built with over 1,500 hours of human labor, LiveResearchBench provides a rigorous basis for systematic evaluation. To evaluate citation-grounded long-form reports, we introduce DeepEval, a comprehensive suite covering both content- and report-level quality, including coverage, presentation, citation accuracy and association, consistency and depth of analysis. DeepEval integrates four complementary evaluation protocols, each designed to ensure stable assessment and high agreement with human judgments. Using LiveResearchBench and DeepEval, we conduct a comprehensive evaluation of 17 frontier deep research systems, including single-agent web search, single-agent deep research, and multi-agent systems. Our analysis reveals current strengths, recurring failure modes, and key system components needed to advance reliable, insightful deep research.
Dataset Example
Example entries from our dataset
What is the size, growth rate, and segmentation of the U.S. electric vehicle market in {{current_year}}? What are the key drivers (policy incentives, charging infrastructure, consumer adoption) and challenges (supply chain, cost pressures)? How do Tesla, BYD, Volkswagen’s ID series, and Ford Mustang Mach-E compare in market share, production capacity, and pricing philosophies across major regions? What flagship models define their positioning, and how are they adapting to competitive and regulatory pressures? The report should be structured with clear sections (and subsections when appropriate), include tables or charts for quantitative comparisons, and provide cited data where available.
Does the report provide data for the U.S. electric vehicle market specifically for the year {{current_year}}?
Does the report discuss the size, growth rate, and segmentation of the U.S. electric vehicle market?
Does the report identify key drivers such as policy incentives, charging infrastructure, or consumer adoption?
Does the report identify key challenges such as supply chain and cost pressures?
Does the report compare Tesla, BYD, Volkswagen’s ID series, and Ford Mustang Mach-E in terms of market share, production capacity, and pricing philosophies?
Does the report compare Tesla, BYD, Volkswagen ID series, and Ford Mustang Mach-E across multiple geographic regions (e.g., North America, Europe, Asia), in terms of market share, production capacity, and pricing philosophy?
Does the report identify the flagship models for Tesla, BYD, Volkswagen's ID series, and Ford Mustang Mach-E that define their market positioning?
Does the report discuss how Tesla, BYD, Volkswagen's ID series, and Ford Mustang Mach-E are adapting to competitive and regulatory pressures?
Leaderboard
| Rank | Agent Name | Presentation & Organization | Fact & Logic Consistency | Coverage & Comprehensiveness | Citation Association | Avg |
|---|---|---|---|---|---|---|
| Single-Agent with Web Search | ||||||
| #1 | GPT-5 | 71.6 | 68.3 | 83.4 | 69.0 | 73.1 |
| #2 | GPT-5-mini | 61.4 | 66.9 | 80.5 | 62.2 | 67.7 |
| #3 | Perplexity Sonar Reasoning Pro | 79.6 | 71.9 | 46.7 | 65.0 | 65.8 |
| #4 | GPT-4.1 | 66.0 | 65.9 | 63.6 | 66.9 | 65.6 |
| #5 | Perplexity Sonar Reasoning | 82.1 | 73.0 | 40.7 | 61.7 | 64.4 |
| #6 | Claude 4 Sonnet | 81.9 | 67.3 | 49.2 | 50.8 | 62.3 |
| #7 | Claude 4.1 Opus | 81.6 | 67.5 | 50.8 | 47.2 | 61.8 |
| #8 | Gemini 2.5 Pro | 51.9 | 76.5 | 73.1 | 44.9 | 61.6 |
| Single-Agent Deep Research | ||||||
| #1 | Grok-4 Deep Research | 69.1 | 57.4 | 86.3 | 64.7 | 69.4 |
| #2 | Perplexity Sonar Deep Research | 83.5 | 67.4 | 65.5 | 52.1 | 67.1 |
| #3 | Gemini Deep Research | 62.1 | 63.0 | 75.8 | 64.6 | 66.4 |
| #4 | OpenAI o3 Deep Research | 71.3 | 64.2 | 85.0 | 30.9 | 62.9 |
| #5 | OpenAI o4-mini Deep Research | 74.3 | 62.3 | 78.6 | 32.1 | 61.8 |
| Multi-Agent Deep Research | ||||||
| #1 | Salesforce AIR Deep Research | 75.9 | 71.7 | 79.3 | 79.0 | 76.5 |
| #2 | Open Deep Research (w. GPT-5) | 81.0 | 71.3 | 65.3 | 77.2 | 73.7 |
| #3 | Deerflow+ (w. GPT-5) | 78.8 | 69.9 | 61.6 | 81.4 | 72.9 |
| #4 | Grok-4 Heavy Deep Research | 75.9 | 59.4 | 89.3 | 64.7 | 72.3 |
| #5 | Manus | 75.0 | 63.1 | 73.3 | 53.8 | 66.3 |
Analysis Depth
Win rate over Open Deep Research - Most systems collect and organize information but struggle to synthesize deeper insights.